How we verify
The rules behind every label, number and source on this site, written down so you can hold us to them.
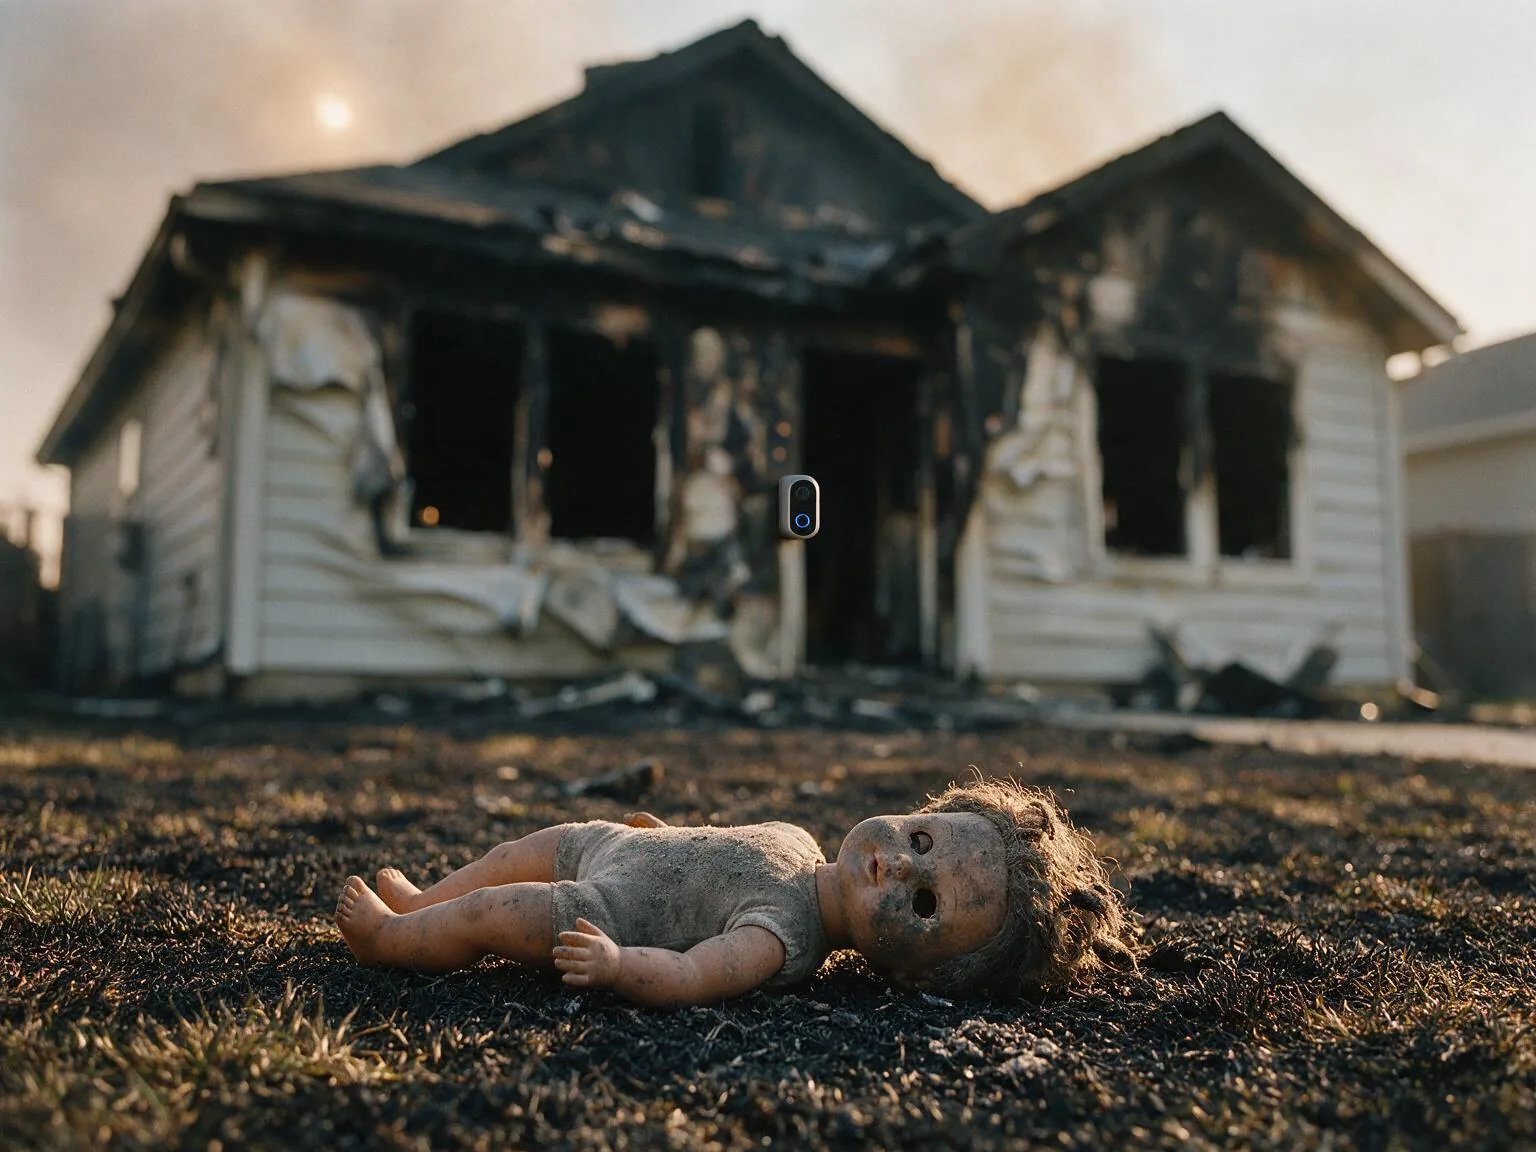
War produces more claims than facts. Our job is to keep the two apart and to show our working. These are the rules we apply. If you catch us breaking one, tell us.
The escalation scale
Most people arriving here want one thing answered first: how bad is this, and how close is it to the worst case? Burying that under a news list would be a failure of nerve. So we publish it as a number, on the front page and in the masthead of every page: the escalation scale, ten levels from sanctions to strategic nuclear exchange.
More than one thing is happening at once. We score each theatre separately against a single shared severity scale, so that a 4 in one theatre means the same order of danger as a 4 in another, even though the events look nothing alike. A site called WW3.press that tracked only one war would be misnaming itself.
A theatre is tracked if escalation there could plausibly draw nuclear-armed great powers into direct conflict with each other. That is the question this site exists to answer. Catastrophic wars that do not carry that risk are not on this scale, and their absence is a statement about great-power escalation, not about their human cost.
The percentage is not a probability
The headline reading — World War III, XX% loaded — is the number most likely to be misread, so here is exactly what it is and is not.
It is a measurement of distance already travelled. Every point in it comes from an event that has already happened and is sourced on the escalation page. It is arithmetic over the record.
It is not a forecast, and not a probability. We do not publish odds of a world war, because we have no honest basis for any, and a made-up percentage would be the easiest lie on this site. “75% loaded” does not mean a 75% chance of anything. It means the worst theatre has crossed seven of ten defined thresholds on the way to a war between great powers, that the level above it already has its precondition in place, and that the fighting is in more than one place at once.
The formula is published in full, with the working shown, so you can recompute it and catch us if it drifts:
- Severity, which dominates: ten points for each level the worst theatre has crossed.
- Armed levels above, which is the part that keeps the number honest between crossings: three tenths of a level for each level above the current one whose preconditions are already in place and sourced, capped at nine tenths. It can fall as well as rise, because a precondition can lapse.
- Breadth: two points for every additional theatre at exchange of fire or worse, capped so breadth can never imply a level nobody has crossed.
- Breadth can only ever add. If we averaged across theatres, adding a quiet one would make the world look safer, which would be both absurd and an invitation to game the number.
- The whole reading is capped one point below the next level’s value. At level seven it can reach 79 but never 80.
- 100% means World War III has begun: two nuclear-armed great powers in direct combat with each other. Not the end of the world — a world war.
The reading can fall, and it has. If it falls we will say so as loudly as when it rises.
The number only means something if it is disciplined. The rules:
- A level is marked crossed only when its criterion has actually been met and we can link the evidence. The generator refuses to publish a level without sources.
- Levels above the current position must state what would trip them. Vague menace is not allowed.
- Where a level above us has a precondition already in place, we say so and source it. These are the genuinely frightening entries, and they are the reason the scale exists.
- The scale can go down. It has twice. Every movement is dated and logged on the escalation page. A number that only ever rises is a marketing device, not an instrument.
- We assign no probabilities to the levels above us. We have no honest basis for one, and a made-up percentage would be the easiest lie on this site.
- The current level is a description of where things stand today. It is not a forecast.
What the level cannot tell you, and what does
A level is a high-water mark. It records the worst threshold a theatre has crossed and then stops moving, however much worse things get while it stands there. That is a real limitation and it had a visible cost: Iran crossed “third countries struck” in April 2026, so when missiles reached Riyadh in September the scale did not move at all, because that rung was already counted.
So every theatre also carries an intensity reading — deepening, steady or easing — describing whether the situation at its current level is still getting worse. It is dated, it changes far more often than a level does, and deepening and easing are claims about the world, so the build refuses to publish either without sources. Steady is the absence of a recorded event and carries none.
Read them together. A theatre can sit at the same level for months while the intensity moves in both directions, and a falling intensity is usually the first sign that a level is about to come down.
Tripwires work the same way. Each is a specific event that would move the scale, marked holding, armed or tripped, and each must say what you would see first — so you can watch for it yourself instead of waiting for us to tell you.
We would rather frighten you accurately than reassure you falsely, and we would rather frighten you accurately than frighten you cheaply. If the scale ever drops, we will lead with that as prominently as we lead with a rise.
When we change the scale itself
On 19 September 2026 we re-spaced the scale and added the two terms above. We are recording it here permanently rather than quietly restating the method, because a measurement whose definition moves without notice is worthless.
What was wrong. Four of the ten levels were reserved for great-power entry and weapons of mass destruction. That capped any conventional war, however terrible, at level six — a regional war with capitals under attack and a global chokepoint broken scored the same as the day the chokepoint first faltered. Combined with the high-water-mark problem above, the instrument had gone deaf.
What changed. A seventh level, regional war at full intensity, now sits between spillover and great-power war. The two mass-destruction levels were merged into one, so the scale is still ten levels and 100% still means a strategic nuclear exchange. Armed levels above the current position now count towards the reading, and every theatre carries an intensity state.
What it did to the number. The reading moved from 62% to 75%, and Iran from level six to level seven. Not one new event was invented to do it: level seven was scored from evidence already published on this site, and every armed level was already documented here and worth nothing. Every other theatre’s position is unchanged.
Then we changed what 100% means, on the same day. The first attempt still put a strategic nuclear exchange at the top, which made the scale say that nuclear weapons being used was one step above a conventional regional war, and that the world was three-quarters of the way to annihilation. Both of those were false, and the second was the cheap fear this page promises to avoid.
So the top of the scale is now the thing this site is named for. World War III is a world war. The First and Second were civilisation-shaking and the world went on afterwards. A third would be too. The top three levels now describe one thing — how close the great powers are to fighting each other, rather than through clients — and level ten is reached when two of them are in direct combat. That is a checkable fact about who is shooting at whom, not a prediction of which event comes first.
Weapons of mass destruction came off the scale entirely. They are measured separately, on every theatre page, because they are a different question. A nuclear weapon could be used in a regional war tomorrow without a world war starting, and a world war could be fought without one. We also separate battlefield use from a strategic exchange against homelands, because treating them as the same thing is how you end up unable to describe what has actually happened. Nothing about that axis is a step on the road to anything; it is true or it is not.
We also deleted our own predictions. Levels above the current position used to name the specific events that would trip them — a particular reactor, particular aircraft, a particular strait. We wrote those. They came from no source and no authority, and publishing them contradicted this page’s promise to make no forecasts: if the world escalated in a shape we had not imagined, the scale would either miss it or we would quietly rewrite the criterion to fit. What each level above us now carries instead is what you should watch — which forces are where, and who is firing on whom — which is an observation, not a script.
What did not change. A level is still only crossed when its published criterion is met and the evidence is linked, the build still refuses to publish a level without sources, the scale can still go down, and we still publish no probabilities.
The four labels
Every item on the front-page board, every line in a “What we know” box and every entry in the claim ledger carries one of four labels.
| Label | What it means | What it takes |
|---|---|---|
| Confirmed | The statement is established. | A primary document, an on-the-record statement by the party the fact concerns, or independent reporting by at least two reliable outlets that are not repeating each other. |
| Claimed | One party says so. | A named government, military, company or group has asserted it, and nobody independent has verified it. We name the claimant every time. |
| Disputed | Reliable sources contradict each other. | At least two credible accounts that cannot both be true. We set out both and say what would settle it. |
| Unverified | It is circulating, and we cannot trace it. | No reliable origin. We print these rarely, and only when the rumour itself is moving events. |
A label describes the state of the evidence on the date shown. Labels change as evidence arrives, and each change is recorded.
What counts as a source
We rank sources by how close they are to the fact.
- Primary documents: reports of the International Atomic Energy Agency, United Nations documents, sanctions designations, court filings, legislation, official data releases.
- On-the-record official statements from the governments, militaries and organisations involved. These confirm what that party says. They do not confirm that it is true.
- News agencies with correspondents and editing standards, chiefly Reuters, the Associated Press and Agence France-Presse.
- Established news organisations and specialist trade publications.
- Rights monitors and non-governmental organisations with a published method. We name the organisation and, where relevant, where it is based and who funds it.
- State media, used as evidence of an official position and labelled as state media.
- Expert analysis, such as satellite-imagery assessments, attributed to the analysts who made it.
A post on a social network is not a source unless the account verifiably belongs to the official or body being quoted.
Numbers, and especially casualty figures
Every number carries three things: who counted, what they counted and the date of the count. Casualty figures from different bodies are printed side by side and are never added together or averaged. A government’s figure for its own losses is labelled as claimed. If an official tally and a rights monitor’s tally differ, we print both and say so.
Quotations
Words inside quotation marks appear exactly as they do in the source we link. If we are working from a translation, we say whose translation it is. We do not reconstruct, tidy or merge quotations.
Unnamed officials
We have no anonymous sources of our own. When an agency report rests on unnamed officials, we say so in the sentence, so that you can weigh it accordingly.
Images, video and maps
We publish no photographs and no video, and no report on this site carries a picture. Footage from a war zone is easy to fake and hard to verify, we have no photographer of our own, and we would rather show you nothing than show you something we cannot stand behind.
What we do publish is drawn. The pictures on the pages about this publication — including the one at the top of this page — are illustrations generated by AI at our instruction. They depict no real event, place or person, they carry no flag, insignia or readable text, and each one is captioned as an illustration, credited on the page and marked in its own file metadata with the IPTC source type for machine-generated material. They never appear over a report. Every instruction that produced one is published in full.
Maps are drawn by us from Natural Earth public-domain boundary data, and the locations of military and nuclear sites are approximate.
Names and places
We use the spellings most common in English-language agency reporting. We write “Persian Gulf”, following United Nations and Associated Press usage. Publication times are given in Coordinated Universal Time (UTC). Events are dated in the local time of the place where they happened whenever the source makes that clear.
How AI is used
We use AI research tools to find, translate, summarise and cross-check public material, and to help draft. Before publication, each factual statement is checked against the source it links to.
AI is never used to generate a quotation, a fact, a figure, a source, a document or any image presented as a record of something that happened, and it is never cited as a source. It is used to make the labelled illustrations on our non-report pages, which is disclosed on every one of them.
If an error gets through, the responsibility is ours, not the tool’s.
Updates and corrections
Each report shows when it was published and when it was last updated. Substantive changes are listed at the foot of the report with the date and time. The front-page board shows the time it was last reviewed. Our corrections policy explains how errors are handled.
What we will not do
- Publish a claim without saying who makes it.
- Present one side’s casualty count as fact.
- Run a rumour as news because it is spreading.
- Use a headline that promises more than the report establishes.
- Remove a published report without leaving a note that says why.
This page was last reviewed on 19 September 2026.